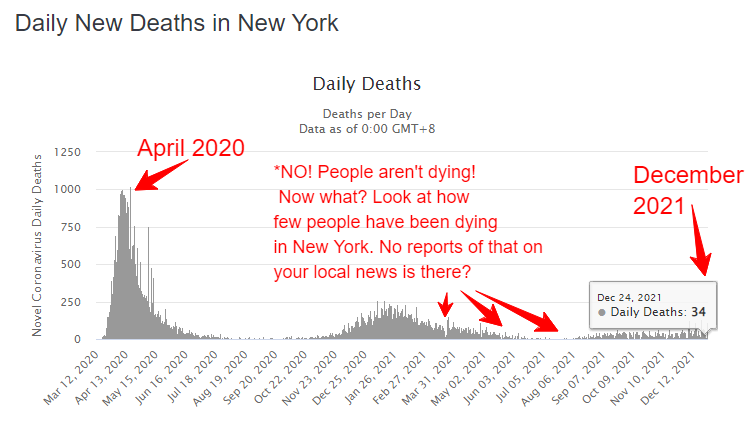


New York! Oh no! (enter Godzilla) It’s like April 2020 again! Wait! Or is it? You are being lied to. The media is fear-mongering again! You REALLY need to change the channel and look at the REAL science below.
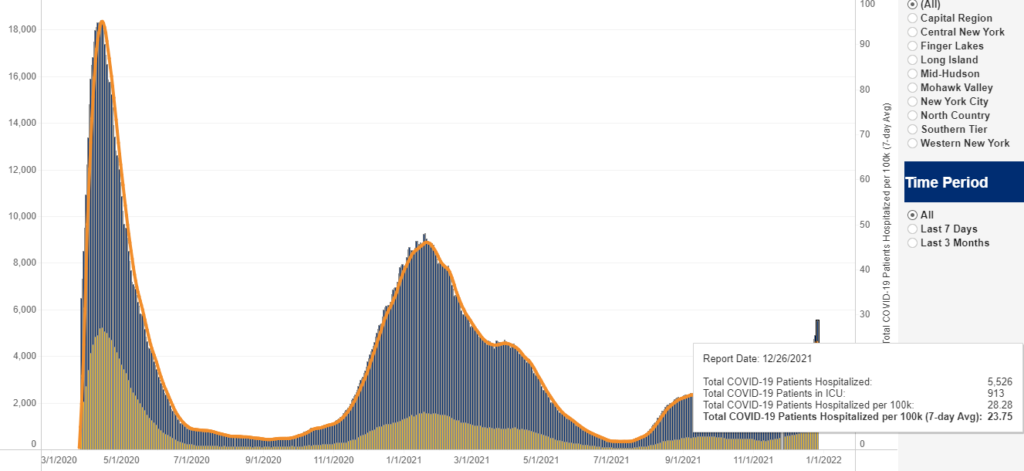
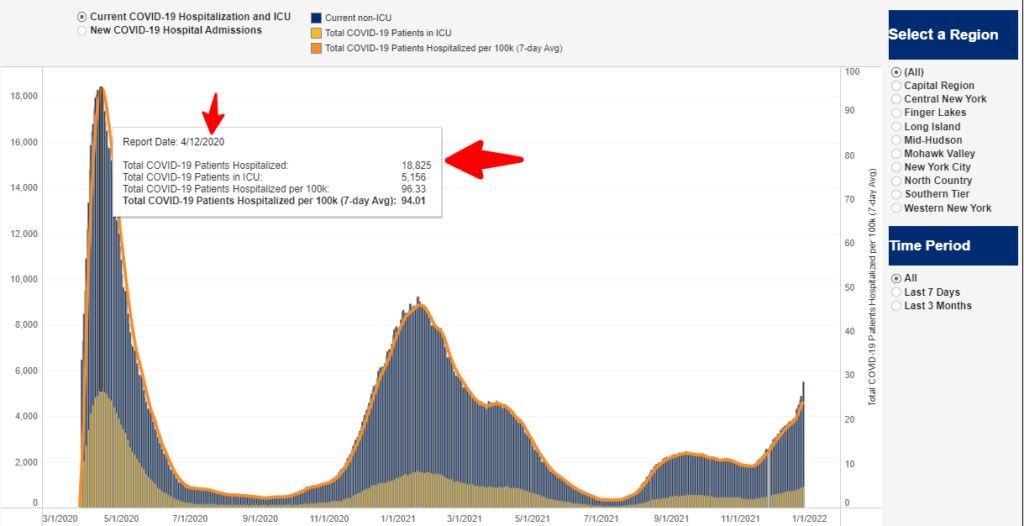
Below are several graphics. First, directly from the State of New York Health Department, the current (December 2021) hospitalizations. Compare that to the second graphic from April 2020 during the height of all of the deaths in NYC. Yep. Do you see it? Much worse. Hence, all of the deaths.
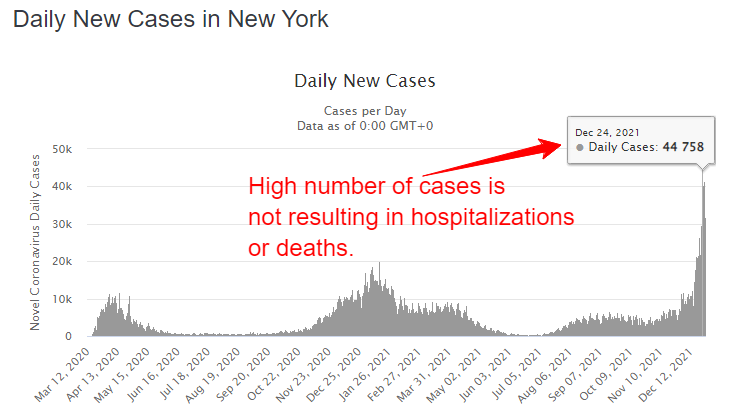
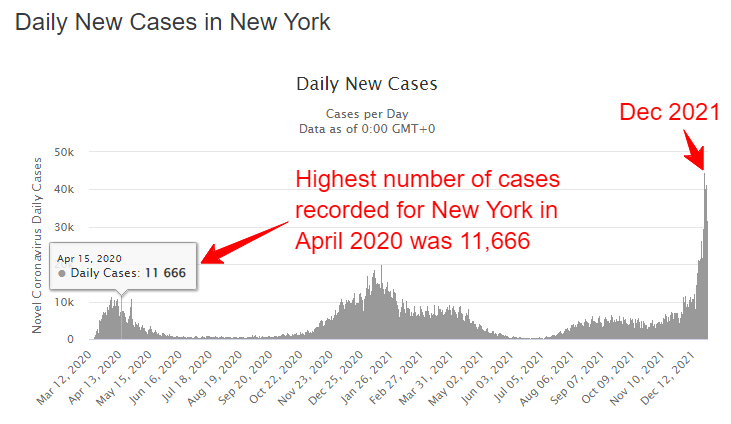
Now, fast forward to this month. There were 44,758 cases in NYC on December 24, 2021 and 5,526 hospitalizations, and only 11,666 cases on April 15, 2020 with 18,825 hospitalizations. Those cases in April of 2020 are what caused all of the deaths.
There were a total of 34 deaths reported on December 24, 2021 in NYC and a total of 1,026 on April 15, 2020.
To recap – April 2020 – 11,666 cases and 1,026 deaths
(that’s an 8.79% death rate based on positive cases)
December 2021 – 44,758 cases and 34 deaths
(that’s a 0.075% death rate based on positive cases )
Can we stop now?
Source – https://coronavirus.health.ny.gov/daily-hospitalization-summary
FYI – This is the REAL science based on REAL data by the State of New York Health Department. 😉👍